
JavaScript is one of the most commonly used programming languages in the web development world. However, every developer occasionally encounters errors in their code. Fortunately, JavaScript has advanced debugging tools and techniques. In this article, we will explain the process of finding and fixing errors in JavaScript, supported by example code blocks.
1. Console Errors
One of the most common errors in JavaScript is console errors. These errors appear in the browser console or your development environment’s console. They are typically caused by simple issues such as syntax errors or undefined variables.
// Example console error
console.log("Hello world")
In the code above, a console error will occur because the console.log() function is missing a semicolon (;) at the end. You can check the browser console to view the error message and correct it.
2. Using Breakpoints
A powerful way to find JavaScript errors is by using breakpoints in your code. A breakpoint allows you to pause the execution of your code at a specific point and inspect variable values.
// Example of using a breakpoint
function sayHello(name) {
    let message = "Hello, " + name;
    debugger; // Breakpoint here
    console.log(message);
}

sayHello("Ahmet");
In the code above, the debugger; statement creates a breakpoint. When the code runs, the process will pause when it reaches this point, and your development environment will give you control to inspect the variables.
3. Inspecting Stack Trace
Another important technique for solving errors is inspecting the stack trace. The stack trace shows where the error occurred and which functions were called.
// Example of inspecting stack trace
function calculateSum(a, b) {
    return a + b;
}

function multiplyByTwo(num) {
   return num * 2;
}

function calculateTotal(x, y) {
   let sum = calculateSum(x, y);
   let total = multiplyByTwo(sum);
   return total;
}

calculateTotal(5, "foo");
In the code above, an error will occur because the calculateTotal function is called with incorrect argument types. The stack trace will help you identify where and why the error occurred.
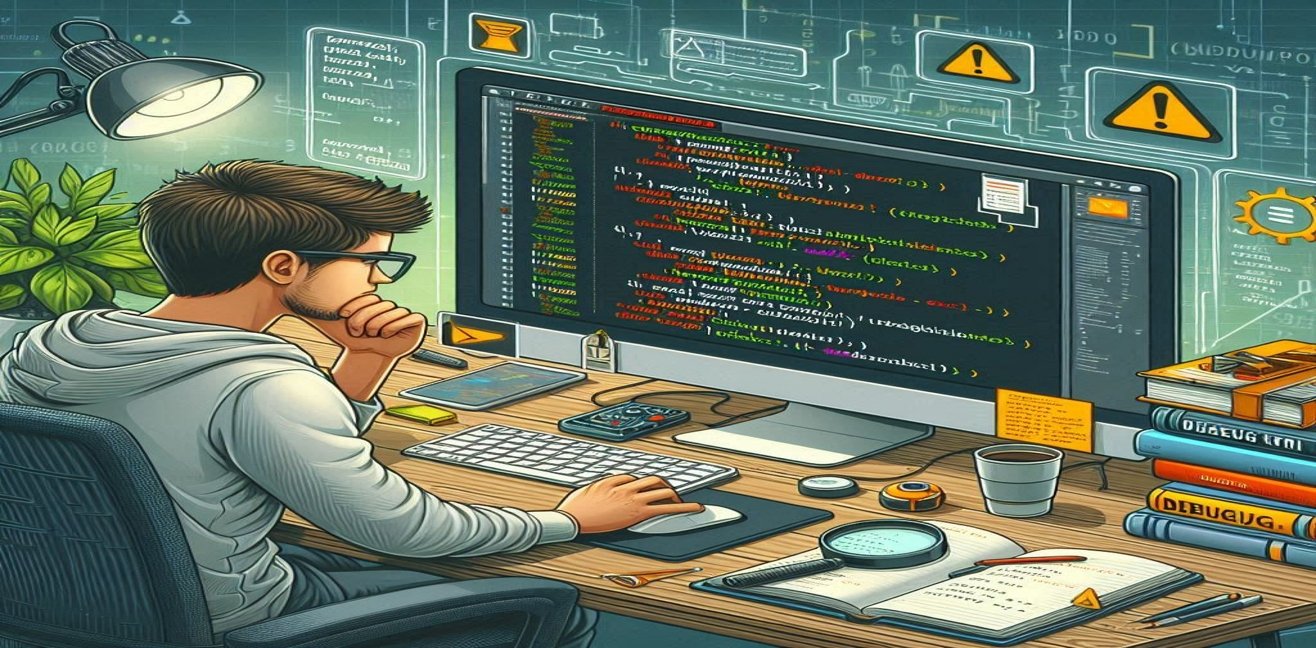
4. Step-by-Step Debugging
Advanced development environments offer a step-by-step debugging feature. This allows you to run your code step by step and track the state of variables as the program executes.
In the screenshot above, a scenario is shown where the development environment steps through the code, and the values of variables are tracked.
Conclusion
JavaScript debugging is a challenge every developer faces, but with the right tools and techniques, you can make this process more manageable. Techniques like checking console errors, using breakpoints, inspecting stack traces, and step-by-step code tracking can simplify the process of finding and fixing errors.